What’s the easiest way to color alternate rows automatically?
Want to add some style to your Excel spreadsheets effortlessly? Discover the simplest method to automatically color alternate rows. No more manual formatting needed! Let's make your data pop with just a few clicks. Watch as your information becomes easier to read and more visually appealing in no time. Say goodbye to bland spreadsheets and hello to a more vibrant and organized look!
;
Introduction:
Whether you're managing a robust dataset or just keeping your own to-do list in Excel, the application's flexibility makes it easy to keep everything organized. One way to further improve readability in your spreadsheets is by color-coding alternate rows, creating a ‘zebra’ effect as seen in some tables. At ExcelBundle, we know how much clean and organized data matters for productivity, and learning to color alternate rows automatically can significantly speed up your workflow. Buckle up as we delve into this step-by-step tutorial on the easiest methods you can use to give your Excel tables a stylish, yet functional, facelift.
Relevant Information:
Automatically coloring alternate rows in Excel is achieved through a feature called 'Conditional Formatting.' This tool allows you to change the format of cells based on certain conditions. In our case, we’re going to use this feature to assign different background colors to odd and even rows.
How to Color Alternate Rows in Excel:
Let's break down the steps you need to take to color alternate rows automatically in Excel:
Select the range of cells that you want to apply the row coloring to. You can do this by clicking and dragging your cursor over the desired area.
Next, click on the 'Home' tab in the ribbon at the top of your Excel window.
In the 'Styles' group, choose 'Conditional Formatting.'
Select 'New Rule' from the drop-down menu that appears.
In the dialog box that opens, select 'Use a formula to determine which cells to format.'
In the 'Format values where this formula is true' box, input the formula =MOD(ROW(),2)=1. This formula will identify odd rows in the selected range.
Click the 'Format' button to the right of the formula box.
In the 'Format Cells' box that opens, select the 'Fill' tab, and choose your desired color for odd rows.
Click 'OK' twice to confirm your formatting rule.
The formatting is immediately applied to the selected cells.
Tips for Success:
Always remember to apply this formatting after your data has been inputted. Changes to your data might cause irregular patterns with the color scheme, especially when adding or deleting rows. If your 'zebra' stripes get messy, just re-apply the color rule to correct it.
Boost Your Spreadsheet Game with ExcelBundle:
By now, you should be a pro at using Excel's built-in tools to color alternate rows, making your spreadsheets easier to read and more visually appealing. This is just the beginning, though. With ExcelBundle, you can take your Excel skills to the next level with our wide variety of ready-made templates. These templates not only save you time but can also help enhance your productivity levels by providing structured, organized content as a starting point for your work.
Conclusion:
As we conclude this tutorial, remember that mastering Excel also means knowing all the tricks in the book! And, as simple as coloring alternate rows might seem, it can drastically improve your efficiency and accuracy when working with large datasets. Happy 'striping'!
Excel is without a doubt one of the best tools on the market for working with analytical, graphical, numerical, and mathematical data. However, using it isn’t always easy—especially if you don’t have much experience and need to create reports and spreadsheets from scratch.
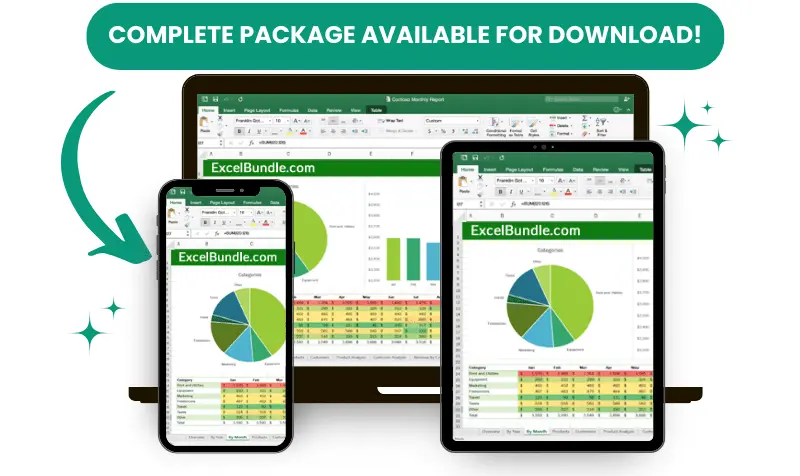
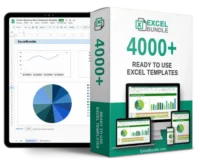
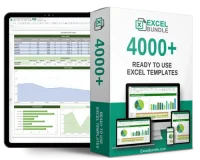
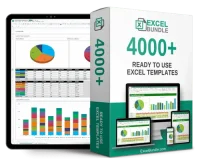
That’s exactly why we’ve put together this incredible, all-in-one package of ready-to-use, fully editable Excel spreadsheet templates. With it, you’ll always have a reliable starting point for your projects.
You’ll get over 4,000 ready-made and fully editable Excel templates covering a wide range of topics and industries—so you’ll always have the exact template you need, ready to use whenever you need it.
Instant Access – Everything Ready and Customizable
We've listed some of the most frequently asked questions from our users
How does the payment work? Is it a one-time payment or a monthly subscription?
It’s a one-time payment.
After completing your purchase, you can download the package immediately and access all updates for one year.
After that, to continue receiving updates, a new license will be required — but everything you’ve already downloaded will continue to work perfectly.
How can I access the purchased product?
After completing your purchase, you’ll be redirected to a download link where you can access the product immediately.
You’ll also receive an email with your order details and a download link for easy access later.
Is it safe to provide my payment or credit card information?
Yes, absolutely.
Our store uses SSL encryption and PCI DSS-compliant payment gateways to ensure your data is fully protected.
We are committed to maintaining the highest standards of payment and data security for our customers.
Can I customize or edit the templates?
Yes! All spreadsheets are fully editable, unlocked, and password-free — so you can customize them freely to suit your needs.
What payment methods are accepted?
PayPal, MasterCard, VISA, American Express, Discover, JCB, Diners Club and Google Pay.
How user-friendly are the Excel templates for someone with no prior experience?
Very user-friendly!
You don’t need any prior experience to use our templates. They’re designed to be simple, intuitive, and easy to navigate — even for beginners.
In fact, thousands of non-professionals have used them to create impressive spreadsheets that deliver real results.
What software are the templates compatible with?
Our spreadsheets are fully compatible with Excel, Google Sheets, Apple Numbers, Zoho Sheet, and LibreOffice.
I still have questions. How can I get in touch?
We’d love to hear from you — questions, feedback, or suggestions help us keep improving.
To get in touch, just [click here].”
Contact Us
Our online support team is always available — 24 hours a day, 7 days a week!
It’s been working great for us so far!
Tech support responded quickly with clear and accurate answers.
We’re very satisfied with the features and functionality.
Brandon Walker
Great bang for the buck, and their technical support has been second to none.
The only hiccup was integrating structured data, which requires a third-party app.
Highly recommend!
Emily Foster
Absolutely love this Excel template bundle! It’s been a lifesaver for a wide range of business needs. The templates are incredibly user-friendly, making my workflow much smoother and more efficient.
Ashley Bennett
I fully recommend this Excel template bundle! It’s a flexible, all-in-one solution for a variety of business needs. The easy-to-use templates have truly streamlined my work and boosted my productivity.
Tyler Mitchell
The Excel Bundle offers a solid collection of templates. The quality is consistent, covering essential tasks without unnecessary complexity. A simple and reliable solution for everyday work.
Megan Davis
Highly recommend this Excel template bundle to my fellow ladies!
The templates are not only versatile but also incredibly easy to use.
They’ve brought simplicity and efficiency to my daily workflow.
Ryan Carter
Excel Bundle delivers solid functionality — a practical tool for efficient spreadsheet work.
It covers all the essentials without unnecessary extras, making it a dependable choice for everyday tasks.
Justin Turner
This Excel template bundle is a real game-changer!
It covers a wide range of business needs, and the templates are incredibly user-friendly.
My workload has become much more manageable and efficient.
Kylie Edwards
This Excel template bundle is a must-have!
It’s versatile, easy to use, and effortlessly meets a variety of business needs.
It has saved me a lot of time by streamlining my tasks efficiently.
Lauren Thompson
This Excel template bundle is a total game-changer for us women in business!
The variety of templates is fantastic, and their ease of use has made task management effortless.
A must-have for boosting productivity.